RETURN to the CHEM 498C Home Page
DC and AC Circuits and Measurements
Chemistry 498A/C Laboratory, Fall 1997
Equipment required: Heath Voltage Reference Source (VRS) ,
resistance decade box, variable power supply, precision 10-turn Helipot with
turns counting dial, 100 µA panel meter, resistance substitution box,
digital multimeter, Hitachi Model V-355 dual-trace 35 MHz oscilloscope, EICO
sine-square wave signal generator.
A: Basic DC Measurements
1. Familiarize yourself with the controls and connections on the
Heath Voltage Reference Source (VRS) and the digital multimeter. Put the
multimeter on its DC voltage ranges and measure a couple of voltages from the
VRS to verify their proper operation and calibration. The VRS and the digital
multimeter should agree within about 1%.
2. Internal resistance of a moving-coil panel meter
Moving-coil panel meters are usually labeled with their full-scale
currents, but not usually with their internal resistances. However, you need
to know this in order to calculate the values of series resistors for passive
voltmeter (and shunt resistances for passive ammeters). It is best not
to try to measure the internal resistance by means of the ohmmeter function of
your digital multimeter, because some ohmmeters may generate enough current to
damage sensitive meters. There is a safe way, however, utilizing Ohm's
Law.
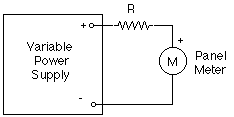
Set the resistance substitution box to 220 KOhms (high range) and
connect it in series with the 100µ A panel meter and the output of your
variable power supply.

Turn on the power supply, turn up the voltage until the panel meter
reads full-scale. Now use your digital multimeter to measure the voltage
across the panel meter terminals, and, given that the full-scale current on the
meter is 100µ A, calculate the internal resistance by Ohm's
Law.
Measured full-scale voltage across panel meter ___________
Calculated internal resistance of panel meter _____________
3. Passive voltmeter
Calculate the series resistance needed to make a 10 volt full-scale
passive voltmeter from your 100µ A panel meter. Given that we have plenty
of 100 KOhms 1% precision resistors on hand, calculate the simplest way you
could make the required series resistance by series and/or parallel
combinations of larger or smaller resistance values. We have a large
collection of 10% carbon resistors in all the "standard" values, stored in the
small parts cabinets on the side of the laboratory. Look at these standard
resistance values and choose the closest standard values(s) that will give you
a total resistance in your series/parallel combination that is within 0.5% of
the theoretically required value. Sketch the circuit of your passive voltmeter
and label the standard resistance values that you intend to use.
Estimate the expected accuracy of your resistance combination, given
the accuracy of its components.
Estimated accuracy, percent relative ______________
In this application, do you have to be concerned about the power rating
of your resistors? Why or why not?
_______________________________________________________
______________________________________________________________________
4. Output voltage and resistance of mystery voltage
source.
You will be given a box with two terminals. This is the Mystery
Voltage Source. Your tasks are (a) to measure the open circuit voltage
across the terminals, in the most accurate way you can think of, using any
equipment present in the laboratory, and (b) to estimate the output
resistance of this voltage source. Hint #1: if the output resistance of
this device is very large, then you won't know how accurately the digital
multimeter can measure it, considering the likelihood of loading errors and
given that you don't know exactly what the digital multimeters input resistance
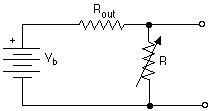
is on its DC voltage ranges. Hint #2: Here is one way to measure output
resistance. Vb represents the ideal open-circuit voltage and Rout its
output resistance. Connect a variable resistance R cross the output and vary
it until the measured output voltage drops to one-half. Then R = Rout.

Describe below how you measured the output voltage of your Mystery
Voltage Source.
Number of your box __________________
Open circuit output voltage ___________________
Output resistance ____________________
B. Oscilloscope and signal generator operation
1. Turn on the oscilloscope and the sine-square wave signal
generator.
2. Set the sine-square wave signal generator to 60 Hz and turn
the sine output level control all the way up (fully
clockwise).
3. Set the following initial conditions on the
oscilloscope:
TIME/DIV: 2 mS
SWP VAR: fully CW
<=> position (small knob): pushed in
Trigger controls (grouped in upper right):
mode: NORM
level: zero (pointer up) and pushed in (+
slope)
source: int
VOLTS/DIV: 5 (small red center knob pushed in)
MODE: CH 1
INT TRIG: CH 1
Channel 1 input switch: DC
4. Connect the sine wave generator output to the Channel 1
vertical input of the oscilloscope. Adjust channel 1's vertical position
vertical position control until the waveform is centered. Adjust the
brightness and focus controls (just to the right of the screen) to obtain a
clear display. You should see a little more than one complete cycle of a sine
wave.
5. Adjust the trigger level control slightly and notice the
effect on the displayed waveform. The trigger level control determines the
vertical deflection (voltage) at which the horizontal sweep is triggered. What
happens when the trigger level is set higher (or lower) than the
waveform goes? Try it. The same thing happens if the peak signal level is so
low that it never exceeds the trigger level setting. Now set the trigger mode
to AUTO and try it again. When the trigger mode is set to NORM, the trace
simply disappears when triggering fails to occur. When the trigger mode is set
to AUTO, then even if the signal never exceeds the trigger level, the
horizontal sweep is triggered automatically at some arbitrary minimum rate.
This way you will always have a trace, even when the input signal is zero or
very low. Leave the trigger mode to AUTO. Pull out the trigger level knob to
set the trigger slope of negative and note the effect. This control determines
whether the trigger will be generated on the up-slope (+) or the down-slope
(-). Push the trigger level knob back in. Switch the trigger source switch to
LINE. The sweep is now triggered by the 60 Hz power frequency rather than by
the displayed signal. Why does the waveform seem to drift across the screen?
Switch the trigger source switch back to INT. Make sure you understand the
relationships between these controls and the displayed
waveform.
6. Measure the maximum peak voltage Ep and frequency (which is
the reciprocal of the period) of the signal generator sinewave output.
Peak voltage: ______________volts. (Should be about 10
volts)
Frequency: _______________ Hz.
7. Measure the signal generator's sinewave output voltage using a
digital voltmeter set to the AC voltage ranges. Compare this reading to the
peak voltage measured by the oscilloscope and show how these two readings are
supposed to be related to each other theoretically.
Meter reading ____________ volts
8. Connect the square-wave output of the signal generator to the
oscilloscope's channel 2 input. Set the display MODE dial to CHOP and the INT
TRIG switch to CH 1. Note that you can adjust the vertical position of the
two waveforms independently with the two vertical position controls, but that
they share a common time axis.
C. RC filters
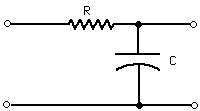
1. A low-pass filter is supposed to pass low-frequencies
with little attenuation and to attenuate (reduce) high frequencies. The
simplest type of filter is the RC filter. Construct an RC low-pass filter from
a 10K resistor and a 0.02 µf capacitor (these values need only be
approximate).
input
 output
Connect the sine output of the signal generator to the input of
the filter and observe this signal on channel 1 and the output of the filter on
channel 2 of the oscilloscope. Set the display MODE dial to CHOP and the INT
TRIG switch to CH 1. Adjust the vertical position controls for the two
channels so that zero is in the center of the screen for both signals.
2. Measure the peak amplitude Ep of the input and output
signals for frequencies of 20 Hz, 50 Hz, 100 Hz, 200 Hz, and so on up to as
high as you can go. Plot the ratio of output to input voltage vs frequency on
log-log paper. At which frequency is the output/input ratio equal to 0.707 ?
This is called the corner or roll-off frequency.
Measured
corner frequency ____________ Hz.
Compare this to the theoretical value of 1/2[pi] RC.
_____________ Hz
What phase shift did you observe between input and output signals
at low frequencies? ____________ At high frequencies? __________
RETURN to the CHEM 498C Home Page


 output